Yesterday I updated the
battery-stats
package in Debian with a few patches sent to me by skilled and
enterprising users. There were some nice user and visible changes.
First of all, both desktop menu entries now work. A design flaw in
one of the script made the history graph fail to show up (its PNG was
dumped in ~/.xsession-errors) if no controlling TTY was available.
The script worked when called from the command line, but not when
called from the desktop menu. I changed this to look for a DISPLAY
variable or a TTY before deciding where to draw the graph, and now the
graph window pop up as expected.
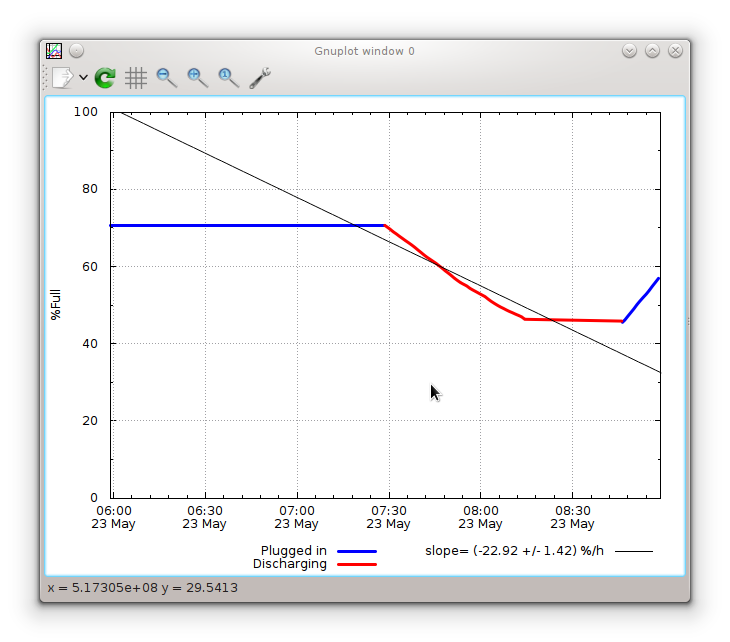
The next new feature is a discharge rate estimator in one of the
graphs (the one showing the last few hours). New is also the user of
colours showing charging in blue and discharge in red. The percentages
of this graph is relative to last full charge, not battery design
capacity.

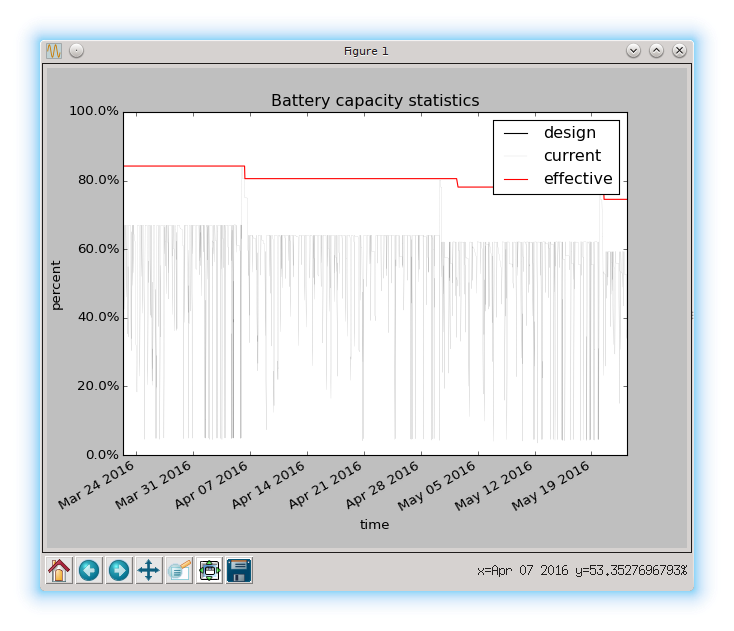
The other graph show the entire history of the collected battery
statistics, comparing it to the design capacity of the battery to
visualise how the battery life time get shorter over time. The red
line in this graph is what the previous graph considers 100 percent:

In this graph you can see that I only charge the battery to 80
percent of last full capacity, and how the capacity of the battery is
shrinking. :(
The last new feature is in the collector, which now will handle
more hardware models. On some hardware, Linux power supply
information is stored in /sys/class/power_supply/ACAD/, while the
collector previously only looked in /sys/class/power_supply/AC/. Now
both are checked to figure if there is power connected to the
machine.
If you are interested in how your laptop battery is doing, please
check out the
battery-stats
in Debian unstable, or rebuild it on Jessie to get it working on
Debian stable. :) The upstream source is available from github.
Patches are very welcome.
As usual, if you use Bitcoin and want to show your support of my
activities, please send Bitcoin donations to my address
15oWEoG9dUPovwmUL9KWAnYRtNJEkP1u1b.

